Transport
A Python program for collecting experimental data from instruments
The source code is available on Github, and the manual and code API are available here.
Source Code Manual APIWhat is it?
Transport is a bit of software I wrote while doing physics research at Penn State collect experimental data.
Here is an outline of features with links to screenshots and more detailed information below:
- Experiments: Users can create nested sequences of actions to manipulate scientific instruments and collect data from them.
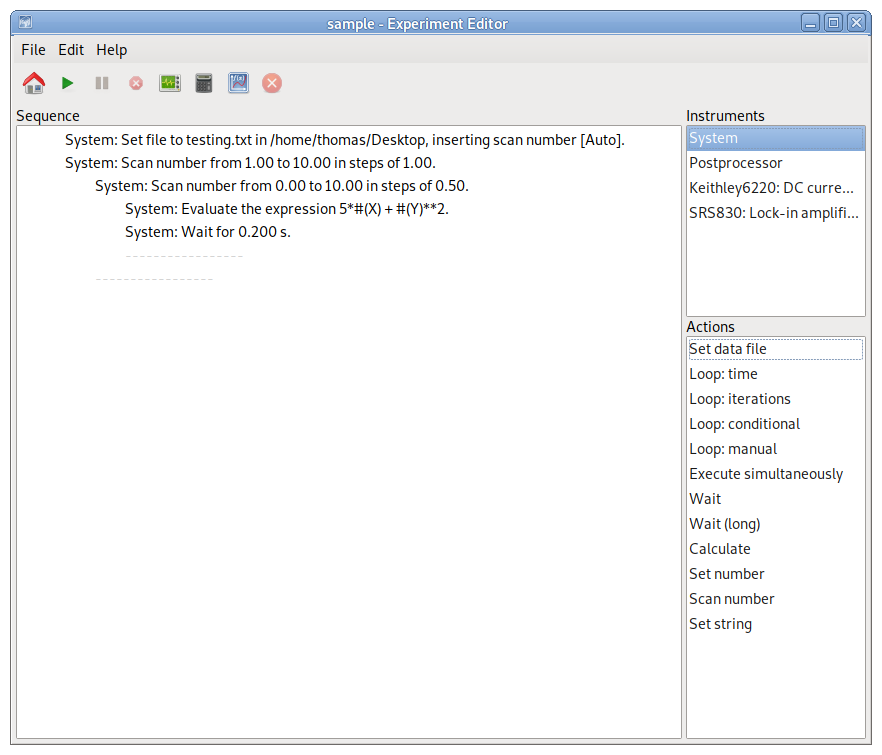
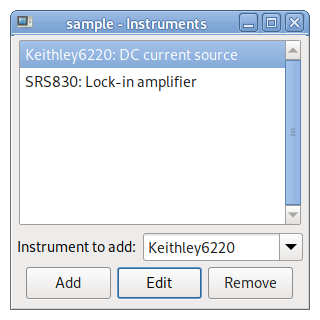
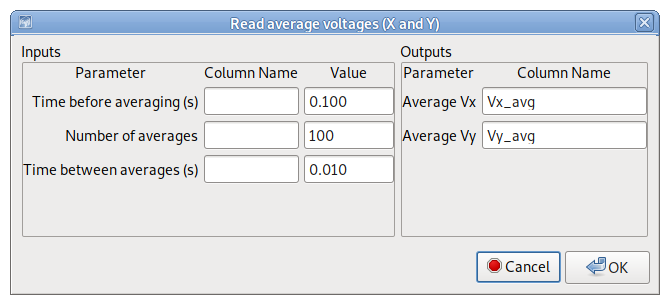
- Instruments and Actions: The instruments and actions are highly configurable via dialogs.
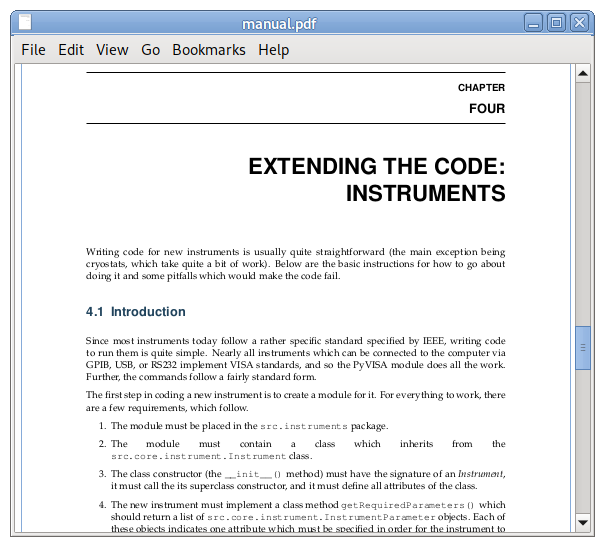
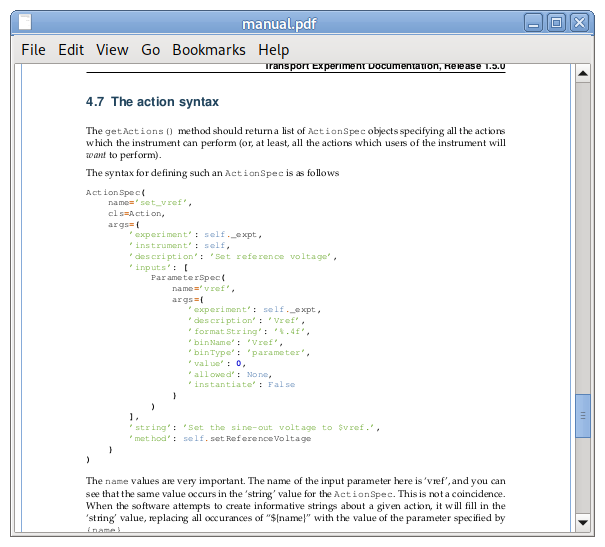
- Extending the Code: A new instrument requires only a single file in the correct location. It will automatically be detected, and configuration dialogs for it and all of its actions will be generated.
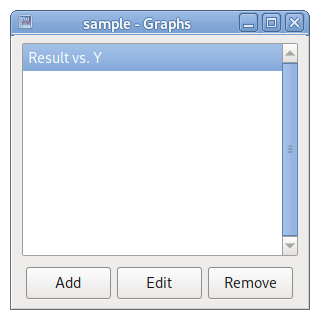
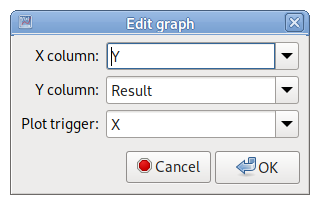
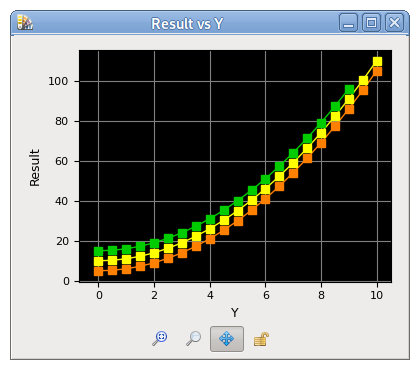
- Graphing: Data can be graphed in real time.
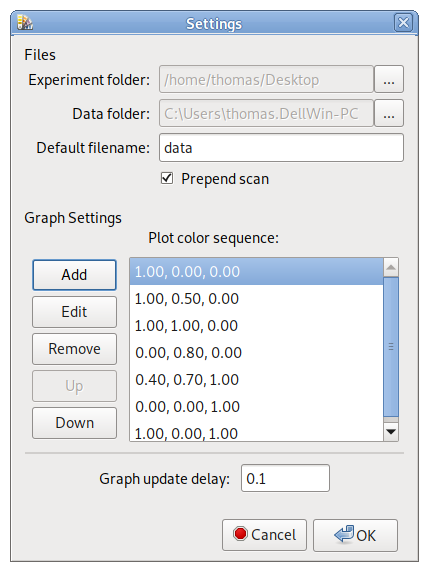
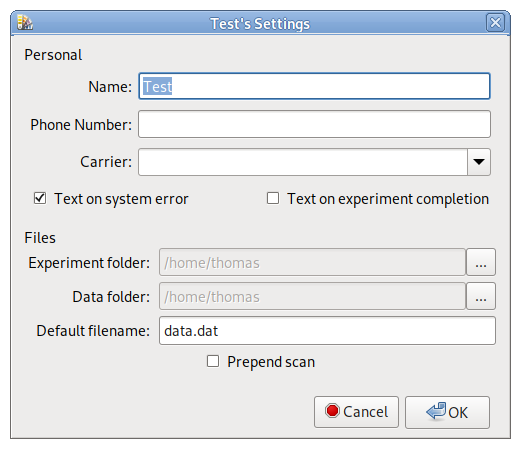
- Configuration: File storage and graph appearances can be configured globally or for each user.
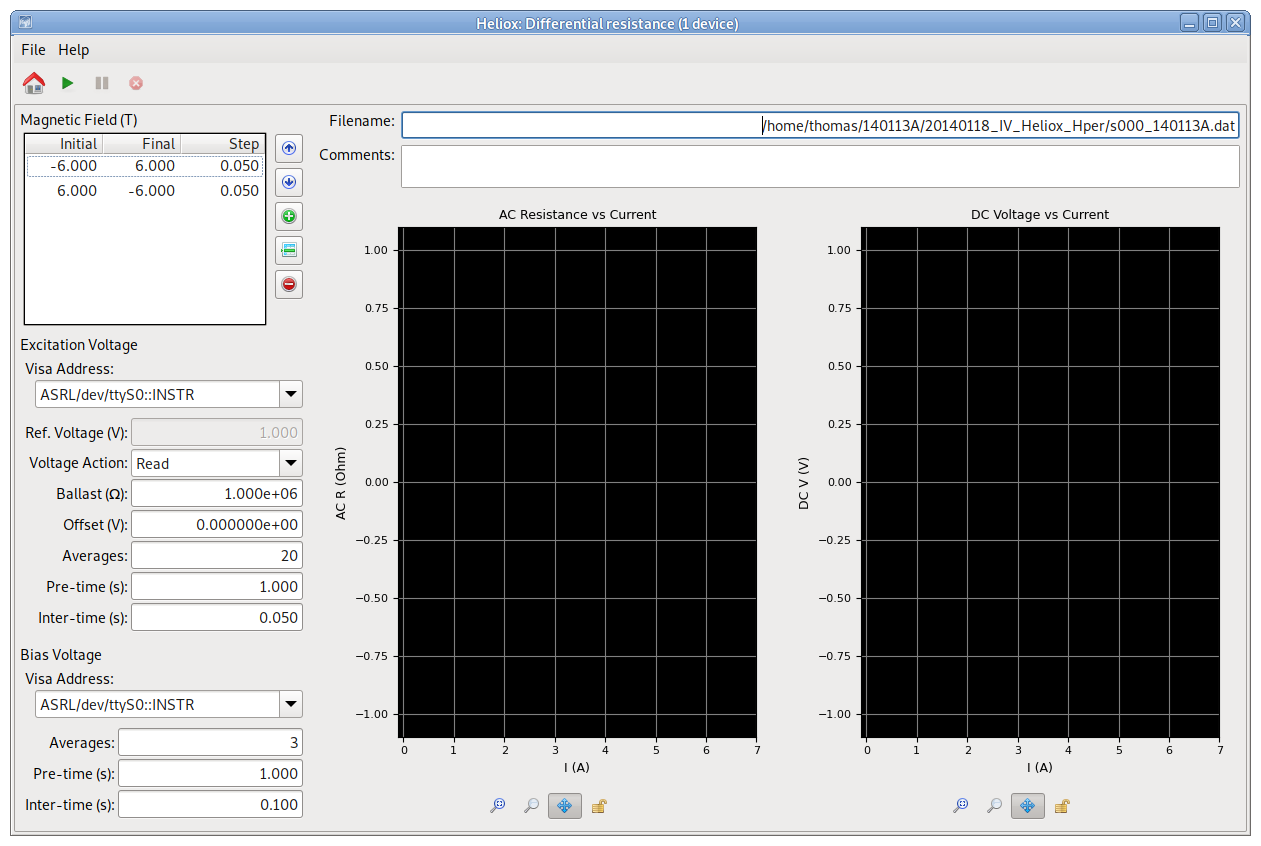
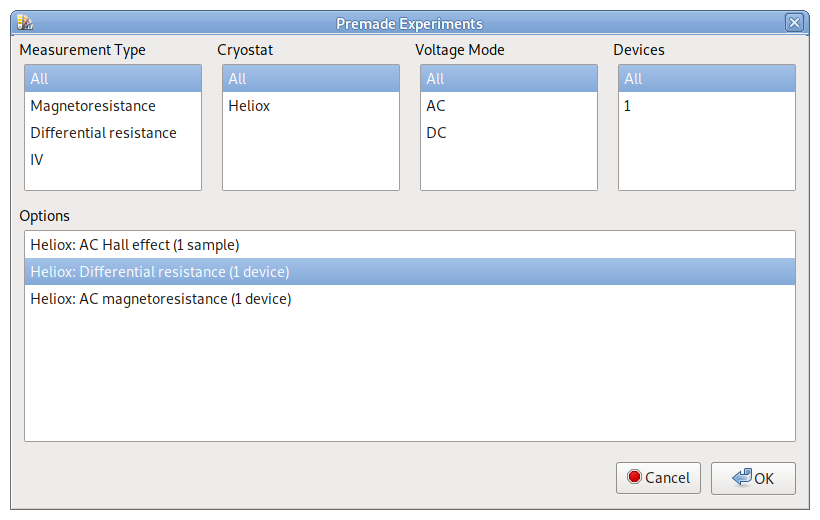
- Premade Experiments: Tailored graphical interfaces can be created for experiments that are run frequently.
Experiments
Instruments and Actions
Extending the Code
Graphing
Configuration
Premade Experiments
It's fairly common in science to perform the same set of measurements over and over, but on different samples. Premade experiments make this easier.
Why was it written?
The typical way that experimental data are collected in research labs is using a “programming language” called LabVIEW, developed by National Instruments. Programs are developed by dragging little squares which represent “virtual instruments”—the LabVIEW equivalent of functions or methods onto a canvas, and data flow is accomplished by making connections, called “wires,” between the inputs and the outputs of various virtual instruments.
LabVIEW has a number of advantages over more traditional programming languages:
- It is fairly self-explanatory to use, so non-programmers can make functional (though, from my experience debugging others’ programs, horribly planned and inelegant) programs.
- It makes user interface design extremely easy: components are dragged-and-dropped onto a “front panel”, just like virtual instruments.
- Implementing multiple threads is trivial—just create a branch when you're drawing wires.
It also has some serious disadvantages.
- Dragging-and-dropping—and digging through the menus and panels to find the virtual instruments to drag and drop—is infuriatingly slow for someone who knows how to type.
- Features of many editors, especially code-completion, cannot be used.
- To avoid confusing novice programmers, the developers of LabVIEW made passing objects by reference rather than by value nearly impossible—it requires patterns that most people would regard as hacks.
- The use of wires to control data-flow makes copying and pasting and search-and-replace difficult.
In my opinion, the disadvantages far outweighed the advantages. Thus, I began looking for ways to communicate with scientific instruments using a textual but reasonably modern programming language. At first, I was looking to do it with Java (my main language at the time). My searches kept bringing up comments about PyVISA, and eventually I ended up learning Python to develop an alternative system for collecting data.